
Introduction
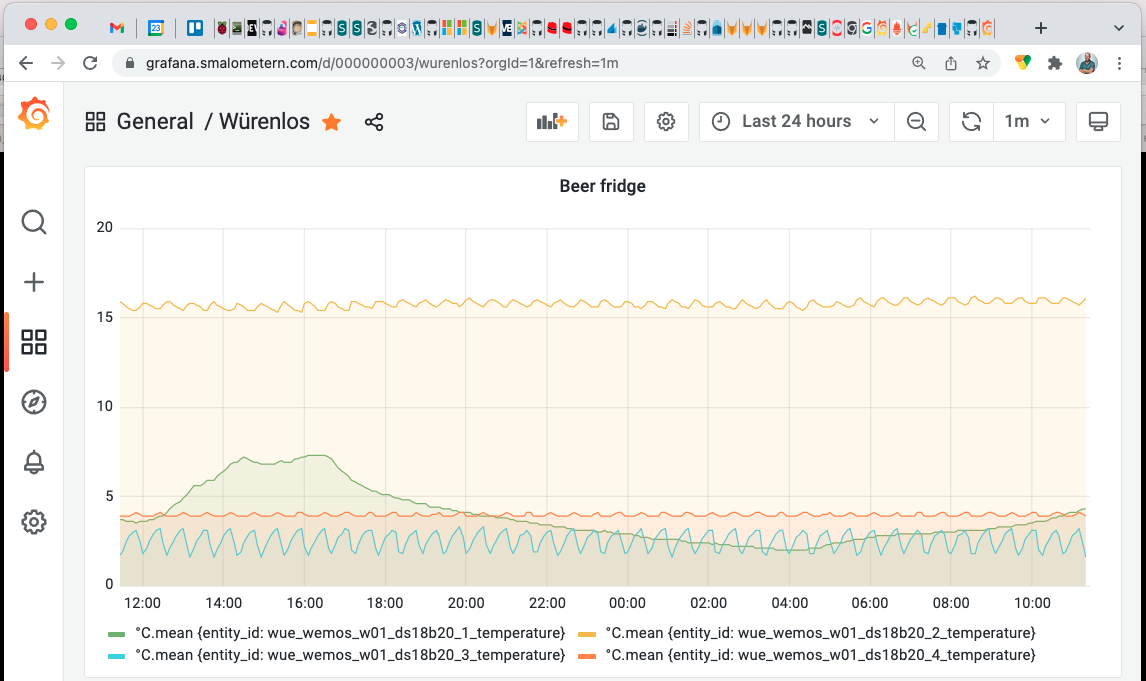
I ran into the following situation in my homelab today; After a failed upgrade I no longer had access to Rancher on my smallish k3s cluster. I really wanted to ceck my grafana instance, and I had not made a backup of the configuration in a while. One way to deal with this would have been to reinstall Rancher, but I really wanted a quick fix and access my Grafana dashbaords quickly. (Hint: it was not a quick fix). I recently started testing Rancher’s take on Kubernetes persistent storage, their Longhorn project[1]. With Rancher down, and I don’t know what more, the ingresses for my services also did not work for some reason (I did not look into why). I did not have an easy way to get hold of the Grafana configuration for dashboards, plugins, and my ldap integration.
TL;DR; - I extracted data from a kubernetes container and set up the same service in a docker container.
The situation I tried to get out of was:
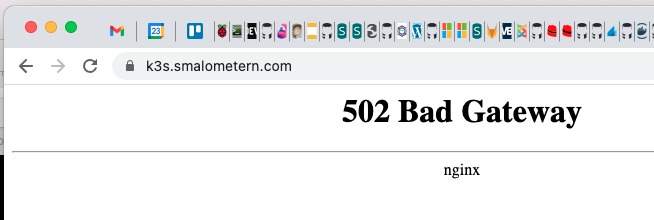
- Broken rancher - no web login available:
- k3s seems to work
- No ingress available
- Storage on Longhorn, not on a local filesystem
Here is what I get when I am trying to access Rancher, a 502.
My k3s installation seems to work, though. I ran kubectl, just to see if my K3S installation was running.
$ export KUBECONFIG=~/k3s/k3s.wue.yaml
$ kubectl get namespaces | grep grafana
grafana                                  Active        462d
$ kubectl -n grafana get pods
NAME                           READY   STATUS    RESTARTS      AGE
wue-grafana-6d5f8d5b7f-kh76m   1/1     Running   2 (15h ago)   2d1h
I could also run bash in the Grafana container:
$ kubectl -n grafana exec -it wue-grafana-6d5f8d5b7f-kh76m -- bash
bash-5.1$ hostname
wue-grafana-6d5f8d5b7f-kh76m

#--- getting the grafana version
bash-5.1$ grafana-server -v
Version 8.3.4 (commit: a551d74b11, branch: HEAD)
At this point I started to feel excited. I was quite sure that I would be able to save the configuration in some way.
Old school exfiltration to the rescue
A good old friend of mine usually says that “It is almost impossible to protect [yourself, a company, a system] against data exfiltration”. This is usually true. Most companies just cannot spend the resources to harden an environment to make data exfiltration impossible. (For an interesting read about TCP over DNS[2] )
First, we have to know a bit about how to backup Grafana. It is quite esasy, they explain it quite well in their upgrade documentation.
A proper Grafana backup consists of:
- Your config files in the
confdirectory - A backup the database (in my case, the built in sqlite3, which is even easier than
postgresormysql) - A backup of the plugins you might have installed
bash-5.1$ hostname
wue-grafana-6d5f8d5b7f-kh76m
bash-5.1$ pwd
/usr/share/grafana
#--- Config files
bash-5.1$ ls -la conf
total 108
drwxr-xr-x    3 root     root          4096 Jan 17 19:42 .
drwxr-xr-x    1 root     root          4096 Jan 17 19:47 ..
-rw-r--r--    1 root     root         42910 Jan 17 19:42 defaults.ini
-rw-r--r--    1 root     root          2270 Jan 17 19:42 ldap.toml
-rw-r--r--    1 root     root          1045 Jan 17 19:42 ldap_multiple.toml
drwxr-xr-x    7 root     root          4096 Jan 17 19:42 provisioning
-rw-r--r--    1 root     root         43461 Jan 17 19:42 sample.ini

#--- Database
bash-5.1$ grep -B1 -E "data_path|grafana.db" conf/defaults.ini

# For "sqlite3" only, path relative to data_path setting
path = grafana.db


#--- The data path
bash-5.1$ ps | grep [g]rafana-server
    1 grafana   0:44 grafana-server --homepath=/usr/share/grafana --config=/etc/grafana/grafana.ini --packaging=docker /bin/bash cfg:default.log.mode=console cfg:default.paths.data=/var/lib/grafana-data cfg:default.paths.logs=/var/lib/grafana-logs cfg:default.paths.plugins=/var/lib/grafana/plugins cfg:default.paths.provisioning=/var/lib/grafana-provisioning

bash-5.1$ ls -la /var/lib/grafana-data
total 5900
drwxrwxrwx    8 grafana  114           4096 Jan 23 09:47 .
drwxr-xr-x    1 root     root          4096 Jan 22 18:07 ..
drwxr-x---    3 grafana  root          4096 Dec  8 16:59 alerting
drwx------    2 grafana  root          4096 Jun 30  2021 csv
-rw-r-----    1 grafana  114        6007808 Jan 23 09:47 grafana.db
drwxr-xr-x    5 grafana  114           4096 Jun 30  2021 plugins
drwxr-xr-x    3 grafana  root          4096 Mar 31  2020 plugins.backup
drwx------    2 grafana  114           4096 Oct 26  2020 png
drwx------   18 grafana  114           4096 Dec 19  2018 sessions
My first couple of ideas was to simply transfer the data out of the container, but the standard tools were not installed and I could not connect to the container as root (not sure if it is possible, I just didn’t try that hard).
bash-5.1$ sftp
bash: sftp: command not found
bash-5.1$ scp
bash: scp: command not found
bash-5.1$ ssh
bash: ssh: command not found
But, since you can run a command remotely with kubectl, I just needed a way to transfer data over a terminal. base64, here we come:
#--- just a simple test
$ kubectl -n grafana exec -it wue-grafana-6d5f8d5b7f-kh76m -- base64 /etc/passwd | head -2
cm9vdDp4OjA6MDpyb290Oi9yb290Oi9iaW4vYXNoCmJpbjp4OjE6MTpiaW46L2Jpbjovc2Jpbi9u
b2xvZ2luCmRhZW1vbjp4OjI6MjpkYWVtb246L3NiaW46L3NiaW4vbm9sb2dpbgphZG06eDozOjQ6
I could now make a backup of two directories:
bash-5.1$ hostname
wue-grafana-6d5f8d5b7f-kh76m
bash-5.1$ pwd
/usr/share/grafana
bash-5.1$ tar czpf /tmp/conf.tgz conf
bash-5.1$ cd /var/lib
bash-5.1$ tar czpf /tmp/grafana-data.tgz grafana-data/grafana.db grafana-data/plugins
bash-5.1$ md5sum /tmp/*.tgz
7b3ceb3defcbe31a43dacc85274a6ed3  /tmp/conf.tgz
fdf77ac250a724a1d3317d986c01401a  /tmp/grafana-data.tgz
The exfiltration of the files, using base64 to convert the binary files to plain old ascii that is very easy to transfer over a terminal/tty.
$ kubectl -n grafana exec -it wue-grafana-6d5f8d5b7f-kh76m -- base64 /tmp/grafana-data.tgz | base64 -D > grafana-data.tgz
$ kubectl -n grafana exec -it wue-grafana-6d5f8d5b7f-kh76m -- base64 /tmp/conf.tgz | base64 -D > conf.tgz
$ md5sum *.tgz
7b3ceb3defcbe31a43dacc85274a6ed3  conf.tgz
fdf77ac250a724a1d3317d986c01401a  grafana-data.tgz
This can be compared to the different checksum, if I am just trying to transfer the conf.tgz file over the terminal:
#--- bad, does not work
$ kubectl -n grafana exec -it wue-grafana-6d5f8d5b7f-kh76m -- cat /tmp/conf.tgz > conf.tgz
$ md5sum *.tgz
9f487f9f6ef7f0f11b883ca08a8d52e0  conf.tgz
Grafana in a docker container
After transferring the .tgz files to my docker host, I now have the files I need for a Grafana installation on my docker host:
$ hostname
com-docker-l01
$ mkdir grafana
$ cd grafana
$ sudo tar xzpf ../backup/conf.tgz ../backup/grafana-data.tgz
$ ls -la
total 56
drwxrwxr-x  5 ops  ops   4096 Jan 23 10:20 .
drwxrwxr-x 13 ops  ops   4096 Jan 23 09:44 ..
drwxr-xr-x  3  472 root  4096 Jan 17 20:42 conf
drwxrwxr-x  6  472 root  4096 Jan 23 11:10 grafana-data
Create the docker-compose.yml file for my grafana
mkdir grafana-backup
cat<<EOT > docker-compose.yml
version: '2'

services:
  grafana:
    image: grafana/grafana:8.3.4
    ports:
      - 3000:3000
    volumes:
      - ./conf:/usr/share/grafana/conf
      - ./grafana-data:/var/lib/grafana
      - ./grafana-backup:/tmp/grafana-backup
EOT
Run docker-compose up without sending it to the background, just to see that it works:
$ docker-compose up
Creating network "grafana_default" with the default driver
Pulling grafana (grafana/grafana:8.3.4)...
8.3.4: Pulling from grafana/grafana
Digest: sha256:cf81d2c753c8d14cf0324d881e49f42d400347d256e473856e1bda02eb520a99
Status: Downloaded newer image for grafana/grafana:8.3.4
Creating grafana_grafana_1 ...
Creating grafana_grafana_1 ... done
Attaching to grafana_grafana_1
...
grafana_1  | t=2022-01-23T10:17:39+0000 lvl=info msg="The state of unified alerting is still not defined. The decision will be made during as we run the database migrations" logger=settings
grafana_1  | t=2022-01-23T10:17:39+0000 lvl=warn msg="falling back to legacy setting of 'min_interval_seconds'; please use the configuration option in the `unified_alerting` section if Grafana 8 alerts are enabled." logger=settings
grafana_1  | t=2022-01-23T10:17:39+0000 lvl=info msg="Config loaded from" logger=settings file=/usr/share/grafana/conf/defaults.ini
grafana_1  | t=2022-01-23T10:17:39+0000 lvl=info msg="Config loaded from" logger=settings file=/etc/grafana/grafana.ini
...
grafana_1  | t=2022-01-23T10:17:39+0000 lvl=info msg="HTTP Server Listen" logger=http.server address=[::]:3000 protocol=http subUrl= socket=
It seems to work, so press <ctrl>\ (control + backslash) to send docker-compose to the background.
grafana_1  | t=2022-01-23T10:20:38+0000 lvl=info msg="Request Completed" logger=context userId=2 orgId=1 uname=maglub method=GET path=/api/live/ws status=0 remote_addr=192.168.9.20 time_ms=1 size=0 referer=
^\Quit
I changed my proxy configuration to point to the docker host on port 3000 instead of my k3s cluster on port 80:
$ git diff playbooks/rproxy/wue-external/rproxy-grafana.smalometern.com.yml
diff --git a/playbooks/rproxy/wue-external/rproxy-grafana.smalometern.com.yml b/playbooks/rproxy/wue-external/rproxy-grafana.smalometern.com.yml
index 7ee6ff4..b4a1ce7 100644
--- a/playbooks/rproxy/wue-external/rproxy-grafana.smalometern.com.yml
+++ b/playbooks/rproxy/wue-external/rproxy-grafana.smalometern.com.yml
@@ -13,14 +8,20 @@
     - sslKeysPath: "/etc/nginx/ssl/{{proxy_fqdn[0]}}"
-    - app_hosts: ["192.168.4.73"]
-    - app_port: 80
+    - app_hosts: ["192.168.4.82"]
+    - app_port: 3000

$ ansible-playbook -i inventories/wue/inventory playbooks/rproxy/wue-internal/rproxy-admin.corp.smalometern.com.yml
And… Success!